Why It Is Necessary to Adjust the Individual Strategies in a Portfolio
Given that strategies have different risks and may be correlated with each other, the question arises as to why it is necessary to adjust the individual strategies in a portfolio to each other.
Optimal Weighting of Strategies in the Portfolio
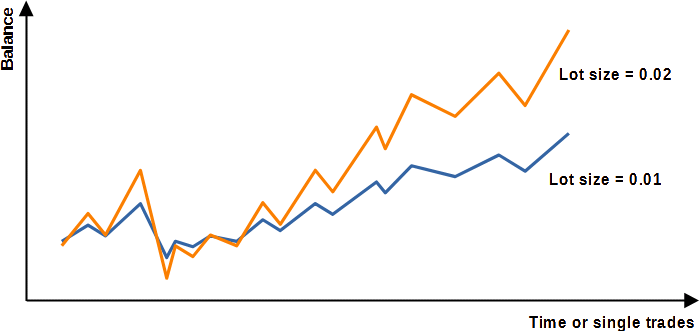
An appropriate portfolio comprises several different strategies or signals (where a strategy corresponds to a signal) based, for example, on different set files or expert advisors. These signals complement each other in such a way that profit is maximized while the risk of losses is minimized, i.e. that the portfolio has the highest possible profit-risk ratio. However, each strategy has a different probability of losses and profits and should ideally be optimally adjusted by the lot size. We refer to the corresponding adjustment or change in lot size as the weighting of a strategy. As an example in figure 1, the strategy in blue (lot size = 0.01) was weighted with a factor of 2 using the lot size, the result is the strategy in orange (lot size = 0.02), which has a double profit and a double drawdown.
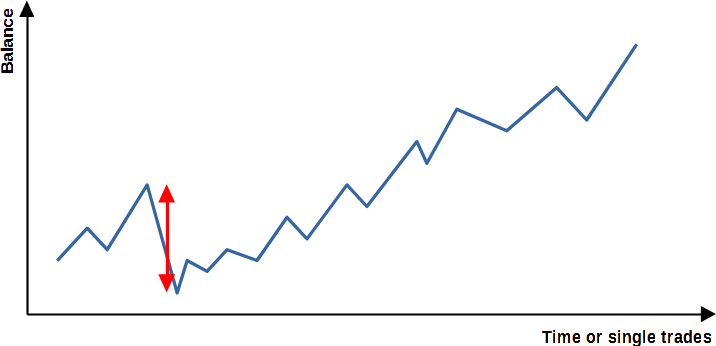
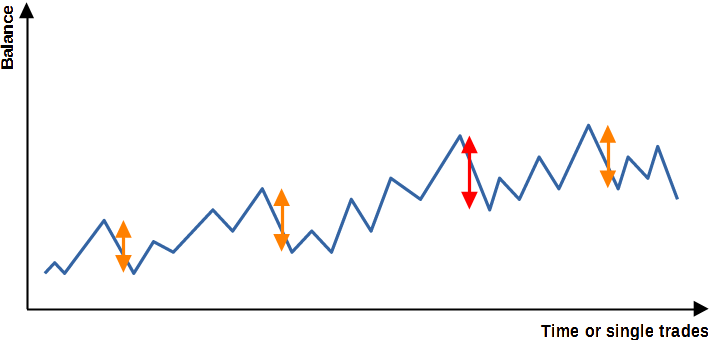
But how do you ensure that the weighting of all strategies in the portfolio is optimal? In other words, how are the different strategies weighted among each other in order to achieve the highest possible profit/risk ratio of the overall portfolio? There are several approaches to this. A simple possibility would be to use the drawdown, i.e. the maximum decline in profits of each strategy, to adjust the weighting of the strategies to each other. However, statistically speaking, this approach would not make sense. For example, a strategy with a larger drawdown (Figure 2 (a)) may be more appropriate than a strategy with a large number of declines (Figure 2 (b)), which may be slightly smaller, but are similar in size to the drawdown of the other strategy. Thus, the strategy in Figure 2 (a) would probably be preferable.
This means that not only the size of the profit decline is important, but also its frequency or, in terms of statistics, its probability of occurrence. In deriving a method we favor, we follow the only two rules of Warren Buffett:
Rule No. 1: Never lose money.
Rule No. 2: Never forget rule No. 1.
Now one must add that an investment without calculated losses is unrealistic, or even impossible. Rather, this quote leads us to put the focus on the possible and calculated loss as the key point for weighting the strategies of a portfolio. As we find, the downside deviation, which is used in the calculation of the Sortino ratio, is a very good way to characterize the risk of loss of a strategy.
Downside Deviation
The Downside deviation (or Target downside deviation, TDD) is the standard deviation of negative asset return and is calculated mathematically as follows, where T is the Desired Target Return of the respective strategy and is set to zero for reasons of comparability.
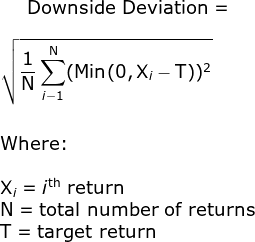
The downside deviation thus characterizes the risk that the strategy will show a loss, the greater the TDD, the greater the probability of a loss. For example, the orange strategy in Figure 1 has twice the TDD compared to the blue strategy because the two strategies are identical except for the weighting (orange corresponds to double the weighting of blue).
Disadvantage of Normalizing All Strategies in a Portfolio to Downside Deviation
Once all strategies have been normalized, the portfolio is no longer dependent on which strategies are the "driving force", i.e. which strategies show the greatest performance in terms of e.g. Return/Drawdown ratio or Calmar ratio. This is because now all strategies do not influence the portfolio depending on their performance but only on their downside deviation. Therefore, it is possible that the portfolio will show worse results in terms of Return/Drawdown ratio and Calmar ratio after optimization. If this should happen, this is acceptable as we want to strictly follow the two rules of Warren Buffett (see above).
Downside deviation – a measure of risk
We believe risk-adjusted returns are one of the most important measures to consider since more return can always be earned by taking more risk. We use the Downside deviation (which is used in the Sortino ratio) to measure the risk and normalize the trading systems.
Sortino Ratio
While the downside deviation characterizes the risk of loss it says nothing about the profitability of a strategy. We can adjust the weighting via the lot size so that the TDD is large, but this also increases the profit in the same proportion. A strategy with a very large TDD can still be very profitable if the profit is also large. And a strategy with a very small TDD can be correspondingly unprofitable if the profit is very small. That is why it is so important to look at the risk of losses and not at the profit when weighting the strategies. The profitability can be calculated using the Sortino ratio, where a higher Sortino ratio means a higher profitability of the strategy. For example in figure 1 both strategies have the identical Sortino ratio.
Sortino ratio – a measure of performance
While the Sharpe ratio is definitely the most widely used measure of risk-adjusted performance, it is not without its issues and limitations. We believe the Sortino ratio improves on the Sharpe ratio in a few areas and is a better tool to measure a trading system. Therefore we mainly focus on the Sortino ratio as a measure of performance.
Correlation Between Strategies
Furthermore, the correlation between the strategies must be considered. For this purpose the correlation between all strategies is calculated and summed up. The reciprocal value of this calculated correlation is called the Independence factor (IF) and describes how independent the strategies are from each other. The greater the independence factor, the more independent the strategy is from all other strategies in the portfolio.
Consider the correlation
The correlation between the strategies must be considered. We use the Independence factor to show how independent the strategies are from each other.
Flowchart of Our Approach for Optimizing a Portfolio
The considerations already made are summarized in the flowchart below.

Example of Improved Portfolio Performance
As an example, we perform a backtest of the Belkaglazer Exper Advisor, analyze its results and show the optimized portfolio performance.
Raw Backtest Results (MetaTrader 5)
The seller provides a very large number of setfiles on his own website. We have decided to make a small selection based on performance. The backtests were performed with MetaTrader 5 between 2012.01.01 – 2020.08.14. Occurring anomalies (e.g. missing ticks for specific time periods) were analyzed with the Quant Analyzer 4 from StrategyQuant. Based on this analysis all further signal processing and statistical analysis were performed with Matlab from MathWorks.
The results can only be viewed properly on high resolution screens. Please also note how we backtest Expert Advisors.
Click on one of the tabs below to open the corresponding backtest
-
NY CloseTrading AUDNZD M5
-
NY CloseTrading EURUSD M5
-
NY CloseTrading GBPUSD M5
-
NY CloseTrading USDCAD M5
-
NY CloseTrading USDCHF M5
-
NY CloseTrading USDCAD M5 (D)
-
Daily levels EURUSD M30 L1 (ATR)
-
Daily levels BTCUSD M30 L1 (ATR)
-
NY CloseTrading USDCHF M1
-
LondonOpen EURUSD M30
-
NY CloseTrading CHFJPY M5 (B)
-
Impulse Intraday BTCUSD M60
-
Impulse Intraday EURUSD M1 (60)
Analysis Results
The lower table shows the calculated parameters. It is clearly visible that the Sortino ratio as well as the Downside deviation vary strongly and two strategies show a high correlation.
| Setfile | Sortino Ratio | Downside Deviation | Independence Factor |
|---|---|---|---|
| 0-Limit[MR][PCh][v1.900][NY_CloseTrading]_AUDNZD_M5 | 1.22 | 1.15 | 1 |
| 0-Limit[MR][PCh][v1.900][NY_CloseTrading]_EURUSD_M5 | 0.49 | 2.36 | 1 |
| 0-Limit[MR][PCh][v1.900][NY_CloseTrading]_GBPUSD_M5 | 1.63 | 1.78 | 1 |
| 0-Limit[MR][PCh][v1.900][NY_CloseTrading]_USDCAD_M5 | 0.97 | 0.9 | 0.54 |
| 0-Limit[MR][PCh][v1.900][NY_CloseTrading]_USDCHF_M5 | 1.41 | 0.75 | 1 |
| 0-Limit[MR][PCh][v1.999][NY_CloseTrading]_USDCAD_M5_(D) | 0.6 | 1.19 | 0.54 |
| 1-Stop[BR][PCh][v1.778][Daily_levels]_EURUSD_M30_L1_(ATR) | 0.62 | 3.6 | 1 |
| 1-Stop[BR][PCh][v1.818][Daily_levels]_BTCUSD_M30_L1_(ATR) | 0.76 | 1.52 | 1 |
| 2-Market[MR][PCh][v1.778][NY_CloseTrading]_USDCHF_M1 | 0.57 | 0.89 | 1 |
| 2-Market[MR][PCh][v1.787][LondonOpen]_EURUSD_M30 | 0.62 | 1.96 | 1 |
| 2-Market[MR][PCh][v1.900][NY_CloseTrading]_CHFJPY_M5_(B) | 0.75 | 1.74 | 1 |
| 3-Market[M][PA][v1.818][Impulse_Intraday]_BTCUSD_M60 | 3.63 | 1.41 | 1 |
| 3-Market[M][PA][v1.900][Impulse_Intraday]_EURUSD_M1_(60) | 1.63 | 2.43 | 1 |
Evaluation and Performance of Single Strategies
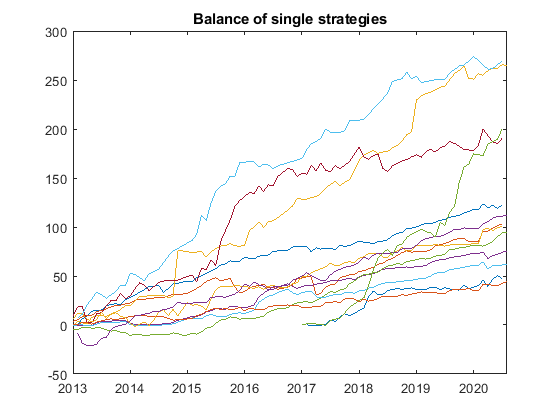
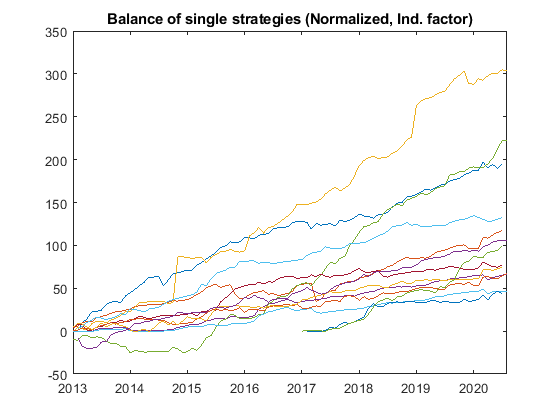
The two following figures show the single strategy results with unweighted performance results (left) and results modified taking into account the Downside deviation and the Independence factor (right). Due to the normalization the final balances in the right curve are irrelevant and not comparable to the left curve. What counts is that the balance sheets with higher risk and higher correlation are weighted lower (right figure).
Improvement of the Portfolio Performance
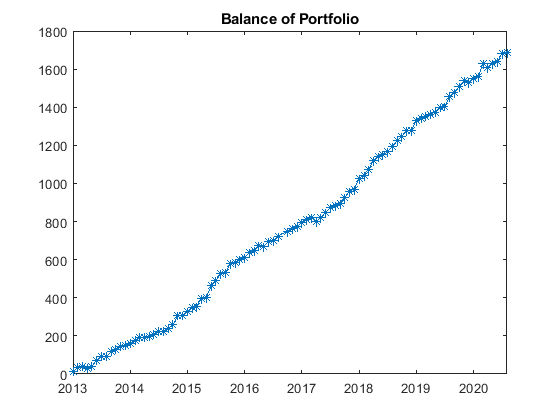
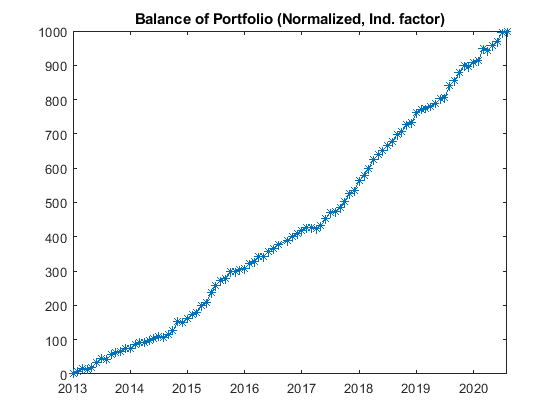
The two following figures show the portfolio balance with unchanged performance results (left) and results modified taking into account the risk and independence factor (right). Due to the normalization the final balance of the right curve is irrelevant, what counts are the slightly smoother curve and the statistics.
Final Statistical Results of the Portfolio
Using the method described above, a significant improvement of more than 120% of the Sortino ratio can be observed.
| Portfolio related factors (on monthly basis) | Unweighted | Weighted | Improvement |
|---|---|---|---|
| Sortino ratio | 5.0112 | 11.0886 | 121.3 % |
| Return/Drawdown ratio | 53.2876 | 73.139 | 37.3 % |
| Calmar ratio | 0.58558 | 0.80373 | 37.3 % |
Weighted: Downside Deviation and Independence factor
There will be moderation of all comments. Please also read our comment rules:
For open discussion, we reserve the right to delete any comment that is not directly on topic or has the sole purpose of disparaging readers or authors. We want people to communicate respectfully with each other, as if the discussion were with real people present. By submitting this form you agree to our Privacy Policy and the storage of your personal data.

Hi!
Could you perhaps explain the workflow for Weighing strategies?
Hello Hai
we will publish a detailed article with examples in the near future. Simplified, the lot size is chosen antiproportional to the downside deviation. Additionally, in case of correlation between strategies, the lot size of corresponding strategies is reduced by a factor derived from the correlation factor.
seems like the trading bot is no longer available for purchase maybe update the page?
Hi james, if you mean Belkaglazer,
you can find the review here.
and the page on mql5 with the MT4 version here.
Greetings!